The Challenge
Boeing needed an efficient and actionable way to measure, report, and reduce its aircraft emissions across global operations.
1. Complex Data Representation:
Emissions data was highly technical and difficult for non-data specialists to interpret.
2. Lack of Real-Time Insights:
Existing tools lacked real-time tracking, causing delays in sustainability initiatives.
3. Actionability Gap:
The previous system reported emissions without clear next steps, limiting teams from making proactive decisions.
4. Stakeholder Buy-in:
Teams needed visual proof of emissions impact to justify sustainability investments.
Discovery and Research
To ensure a user-centred approach, I conducted deep research to understand how Boeing’s teams currently managed emissions data.
Research Activities:
• User Interviews:
Engaged with aerospace engineers, sustainability officers, and flight operation teams to uncover pain points.
• Competitor Benchmarking:
Analysed existing aviation sustainability platforms to identify best practices.
• Data Science Collaboration:
Worked closely with data scientists to simplify complex emissions models into digestible insights.
• Usability Testing:
Conducted low-fidelity prototype tests to validate ease of use.
Key Insights
Teams struggled to interpret raw emissions data.
Decision-makers needed predictive insights, not just historical data.
Pilots and engineers had different needs.
Design Process
Wireframing & Information Architecture
-
Defined core workflows for different user types (e.g., Sustainability Officers vs. Pilots).
-
Simplified data hierarchy, ensuring key insights were one glance away.
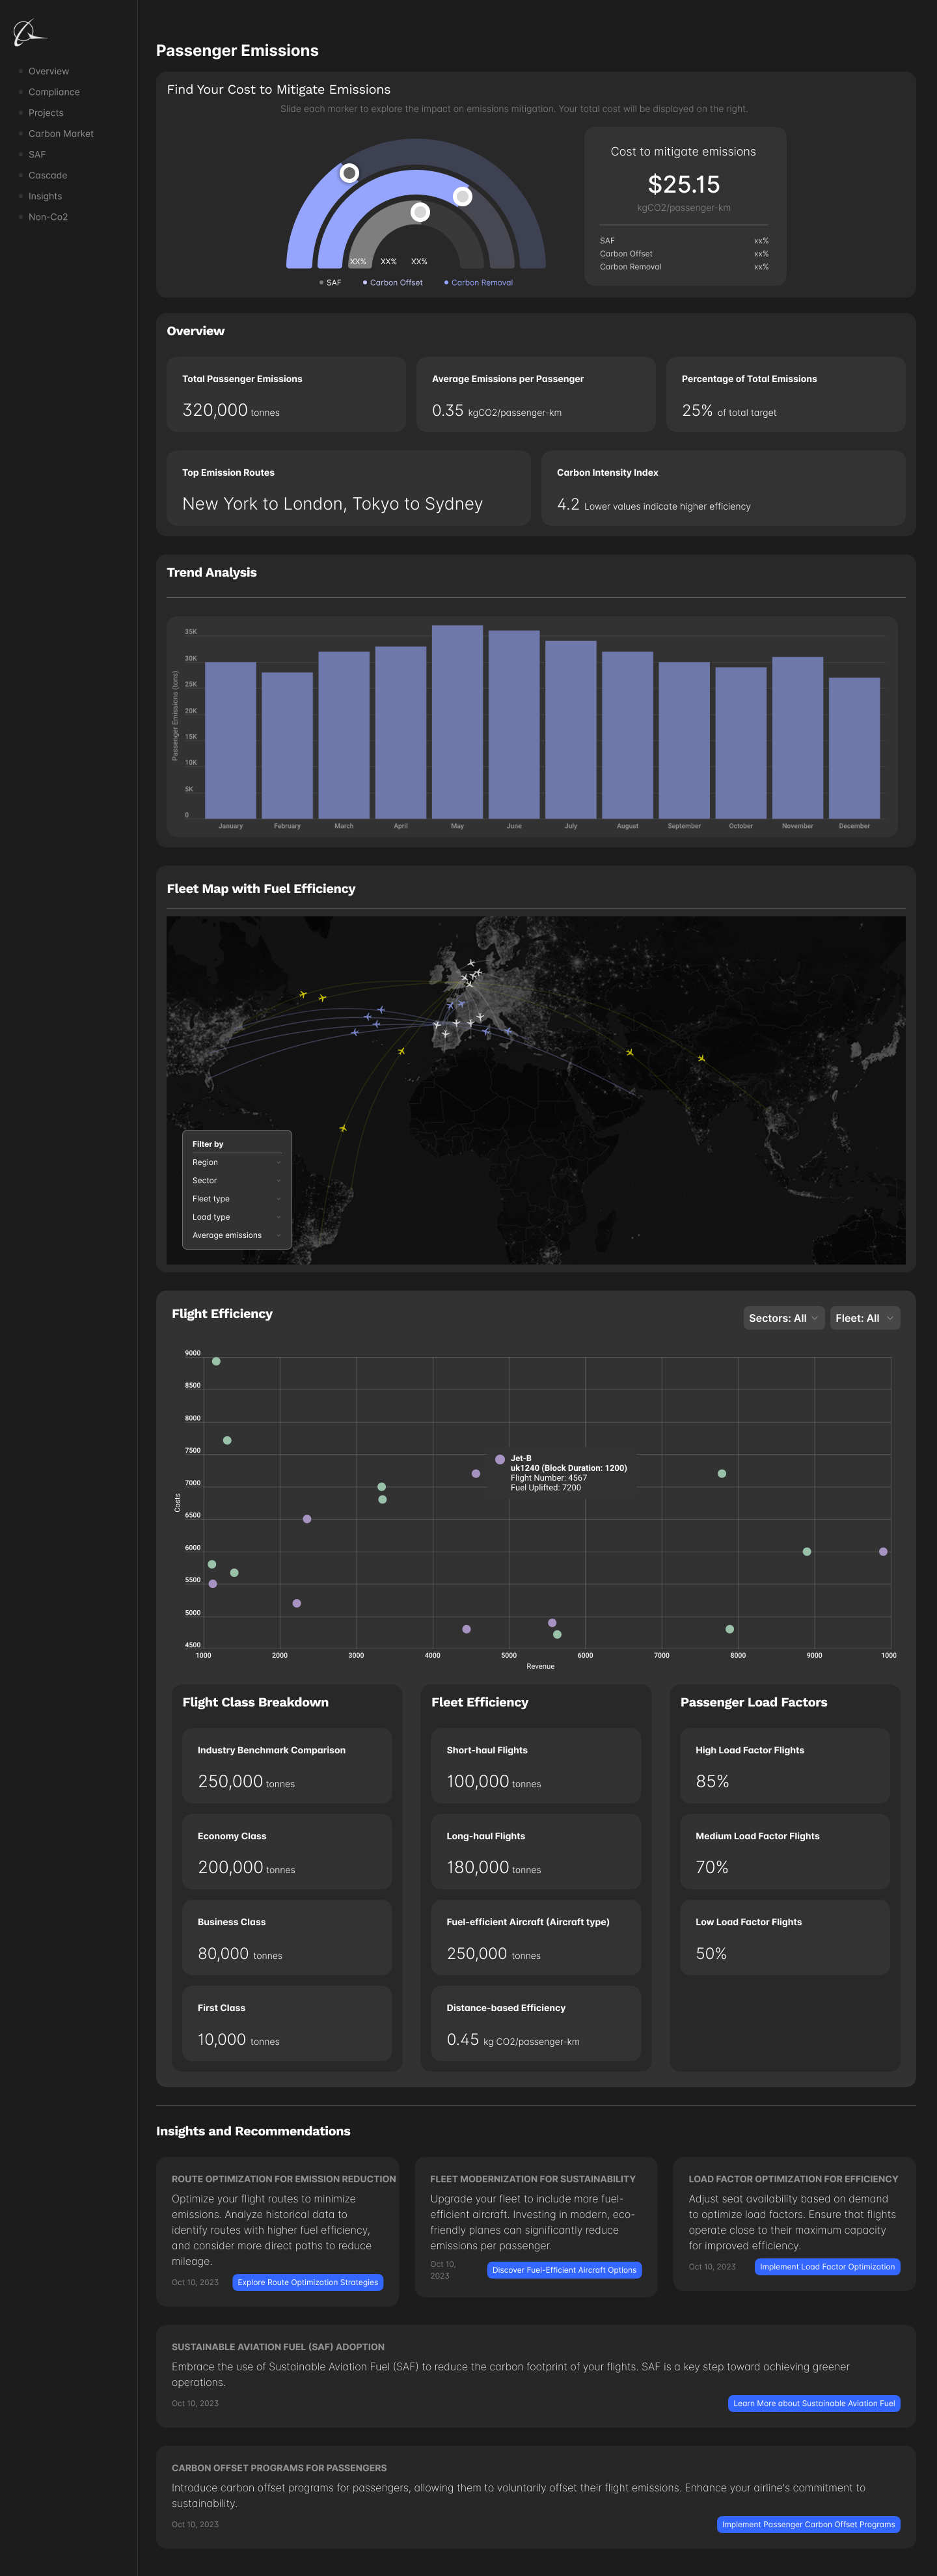
Data Visualisation & Interaction Design
-
Designed interactive charts that allowed users to filter emissions data by aircraft model, route, and fuel type.
-
Developed a CO₂ savings simulation tool, showing how small operational changes (e.g., adjusted flight altitudes) could reduce emissions.
Prototyping & Iteration
-
Low-Fidelity: Paper sketches and wireframes tested with sustainability teams.
-
Mid-Fidelity: Clickable Figma prototypes to validate navigation flows.
-
High-Fidelity: Final UI designs featuring dark mode for pilots and engineers working in low-light conditions.
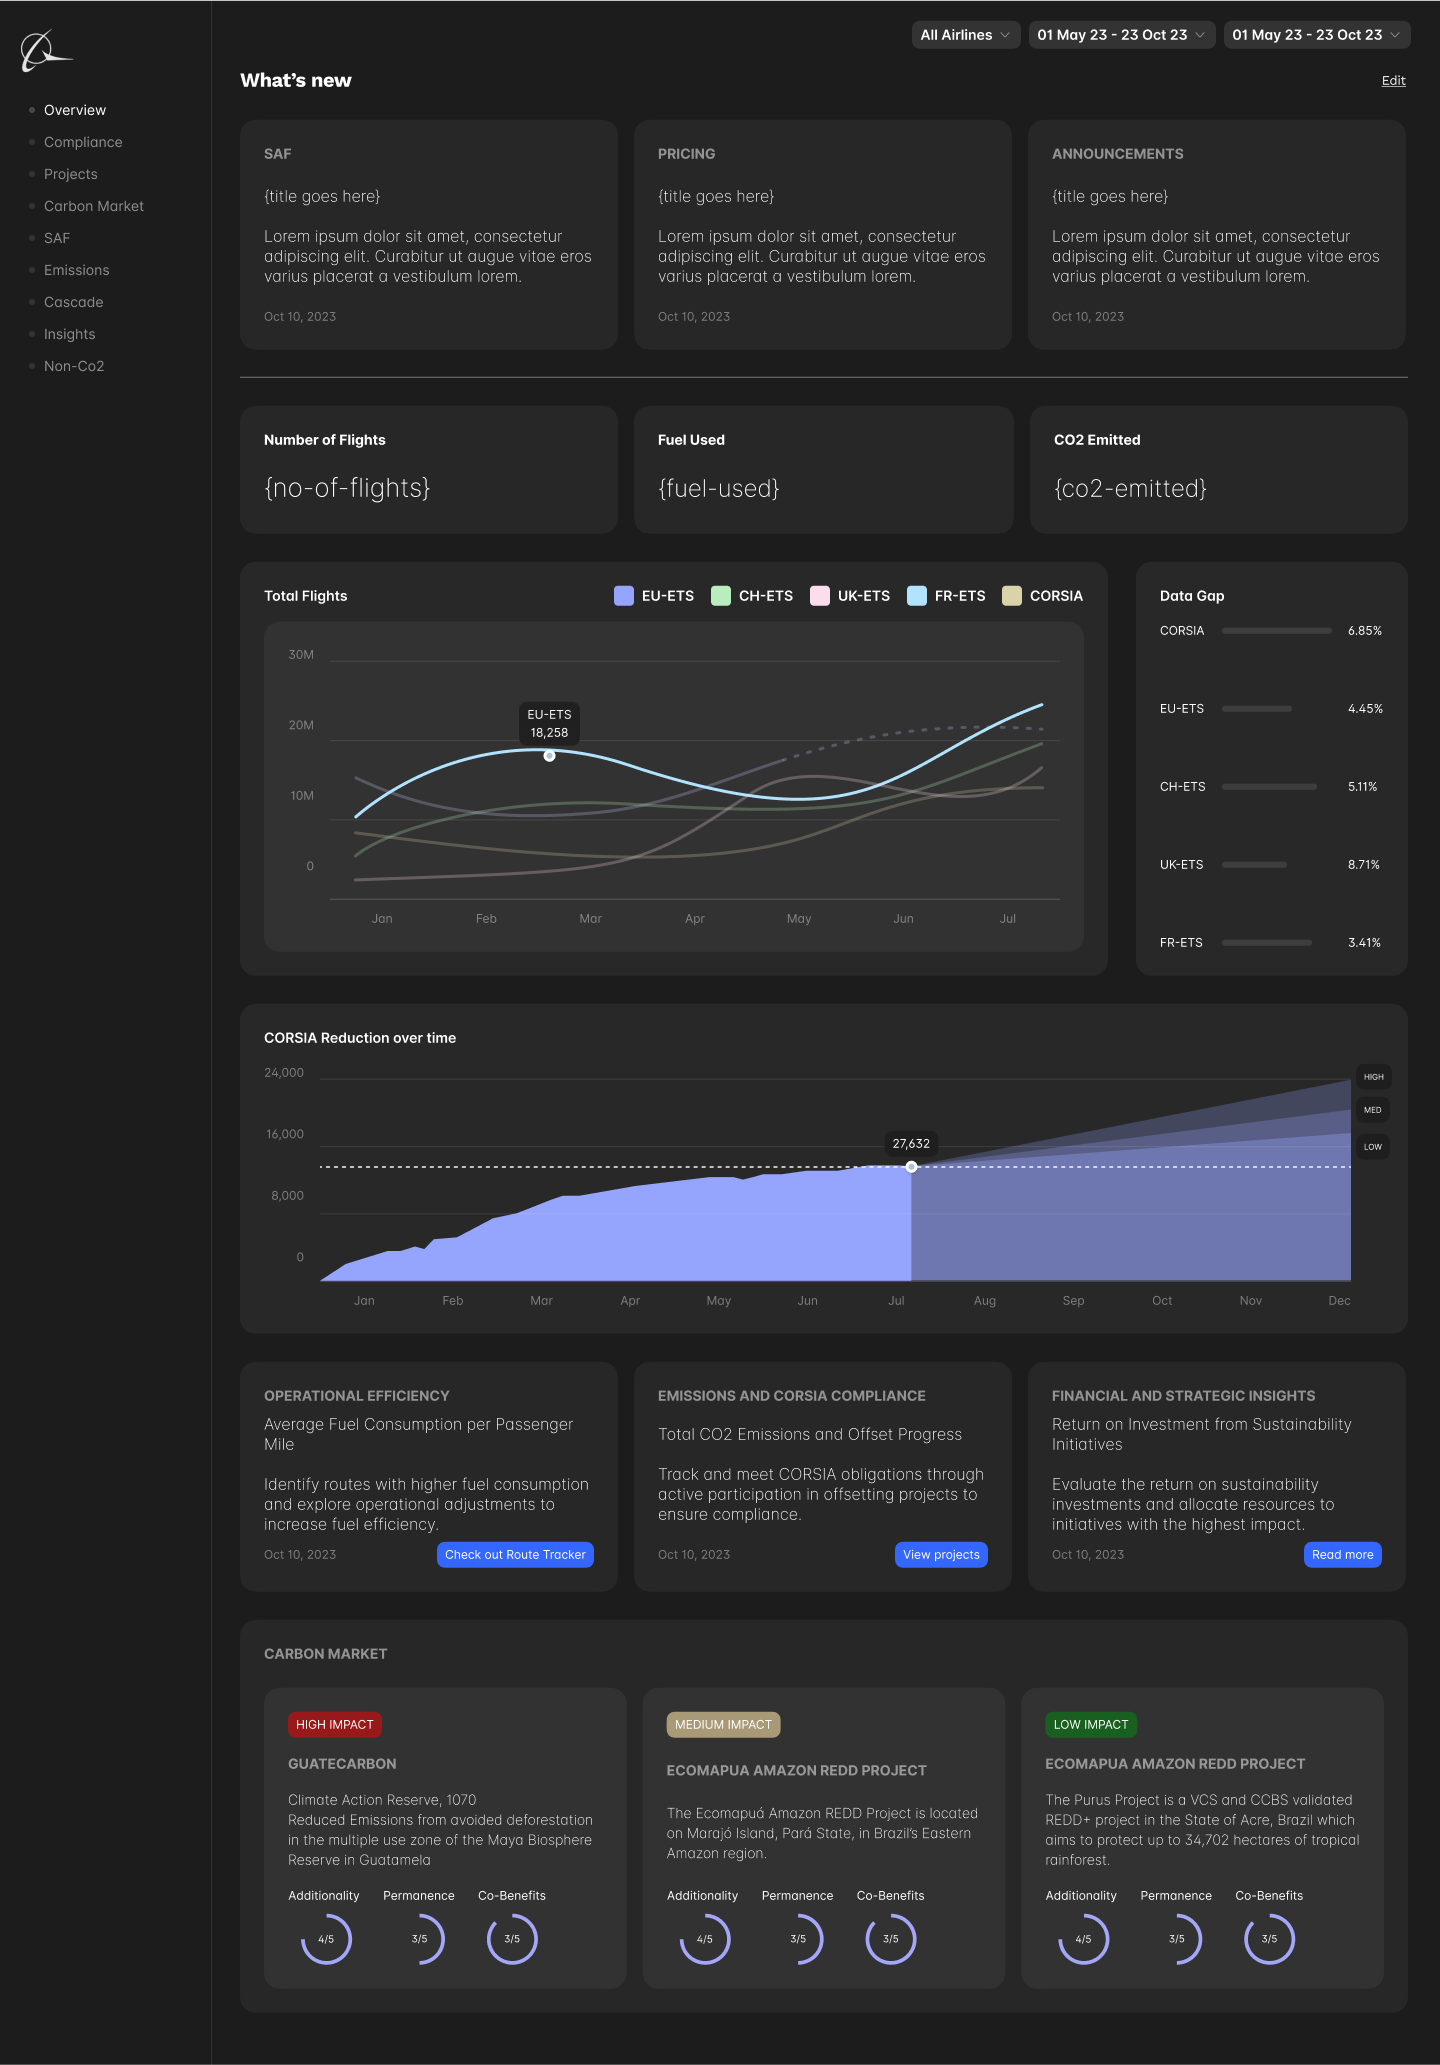
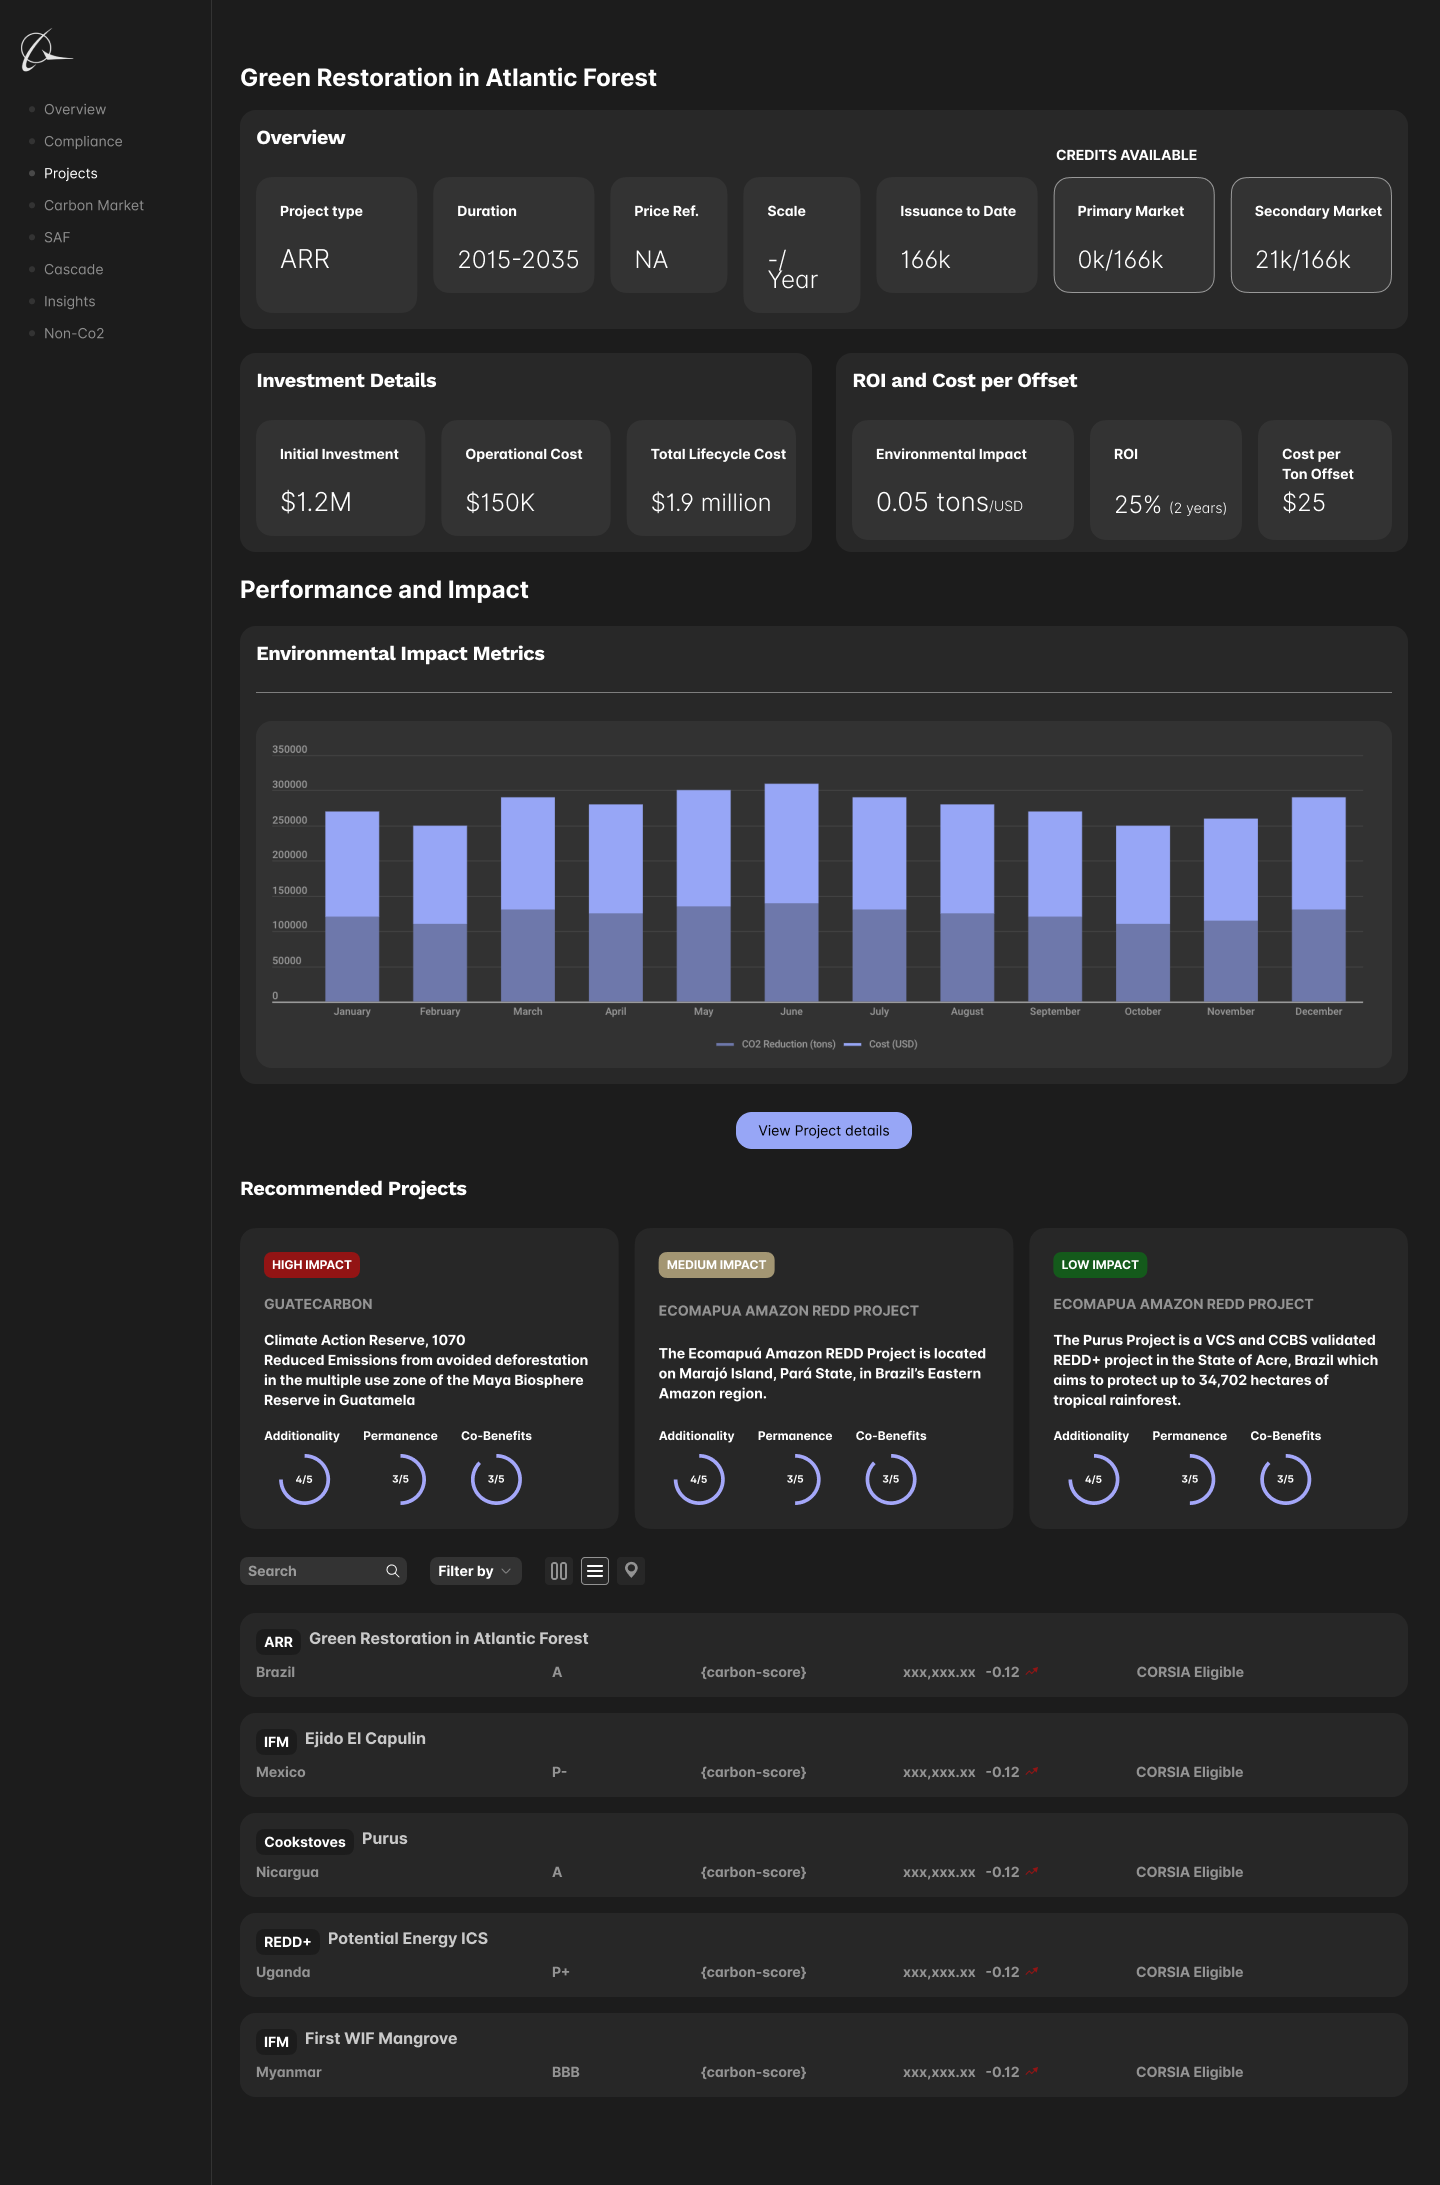
The Boeing Carbon Emissions Dashboard
The final product was a real-time emissions monitoring platform that enabled:
Clear Data Representation:
- Interactive charts that displayed fuel consumption, emissions levels, and reduction opportunities.
Predictive Insights:
- AI-powered recommendations to optimise fuel usage and reduce emissions per flight.
Personalised Dashboards:
- Engineers, pilots, and sustainability teams had custom views tailored to their needs.
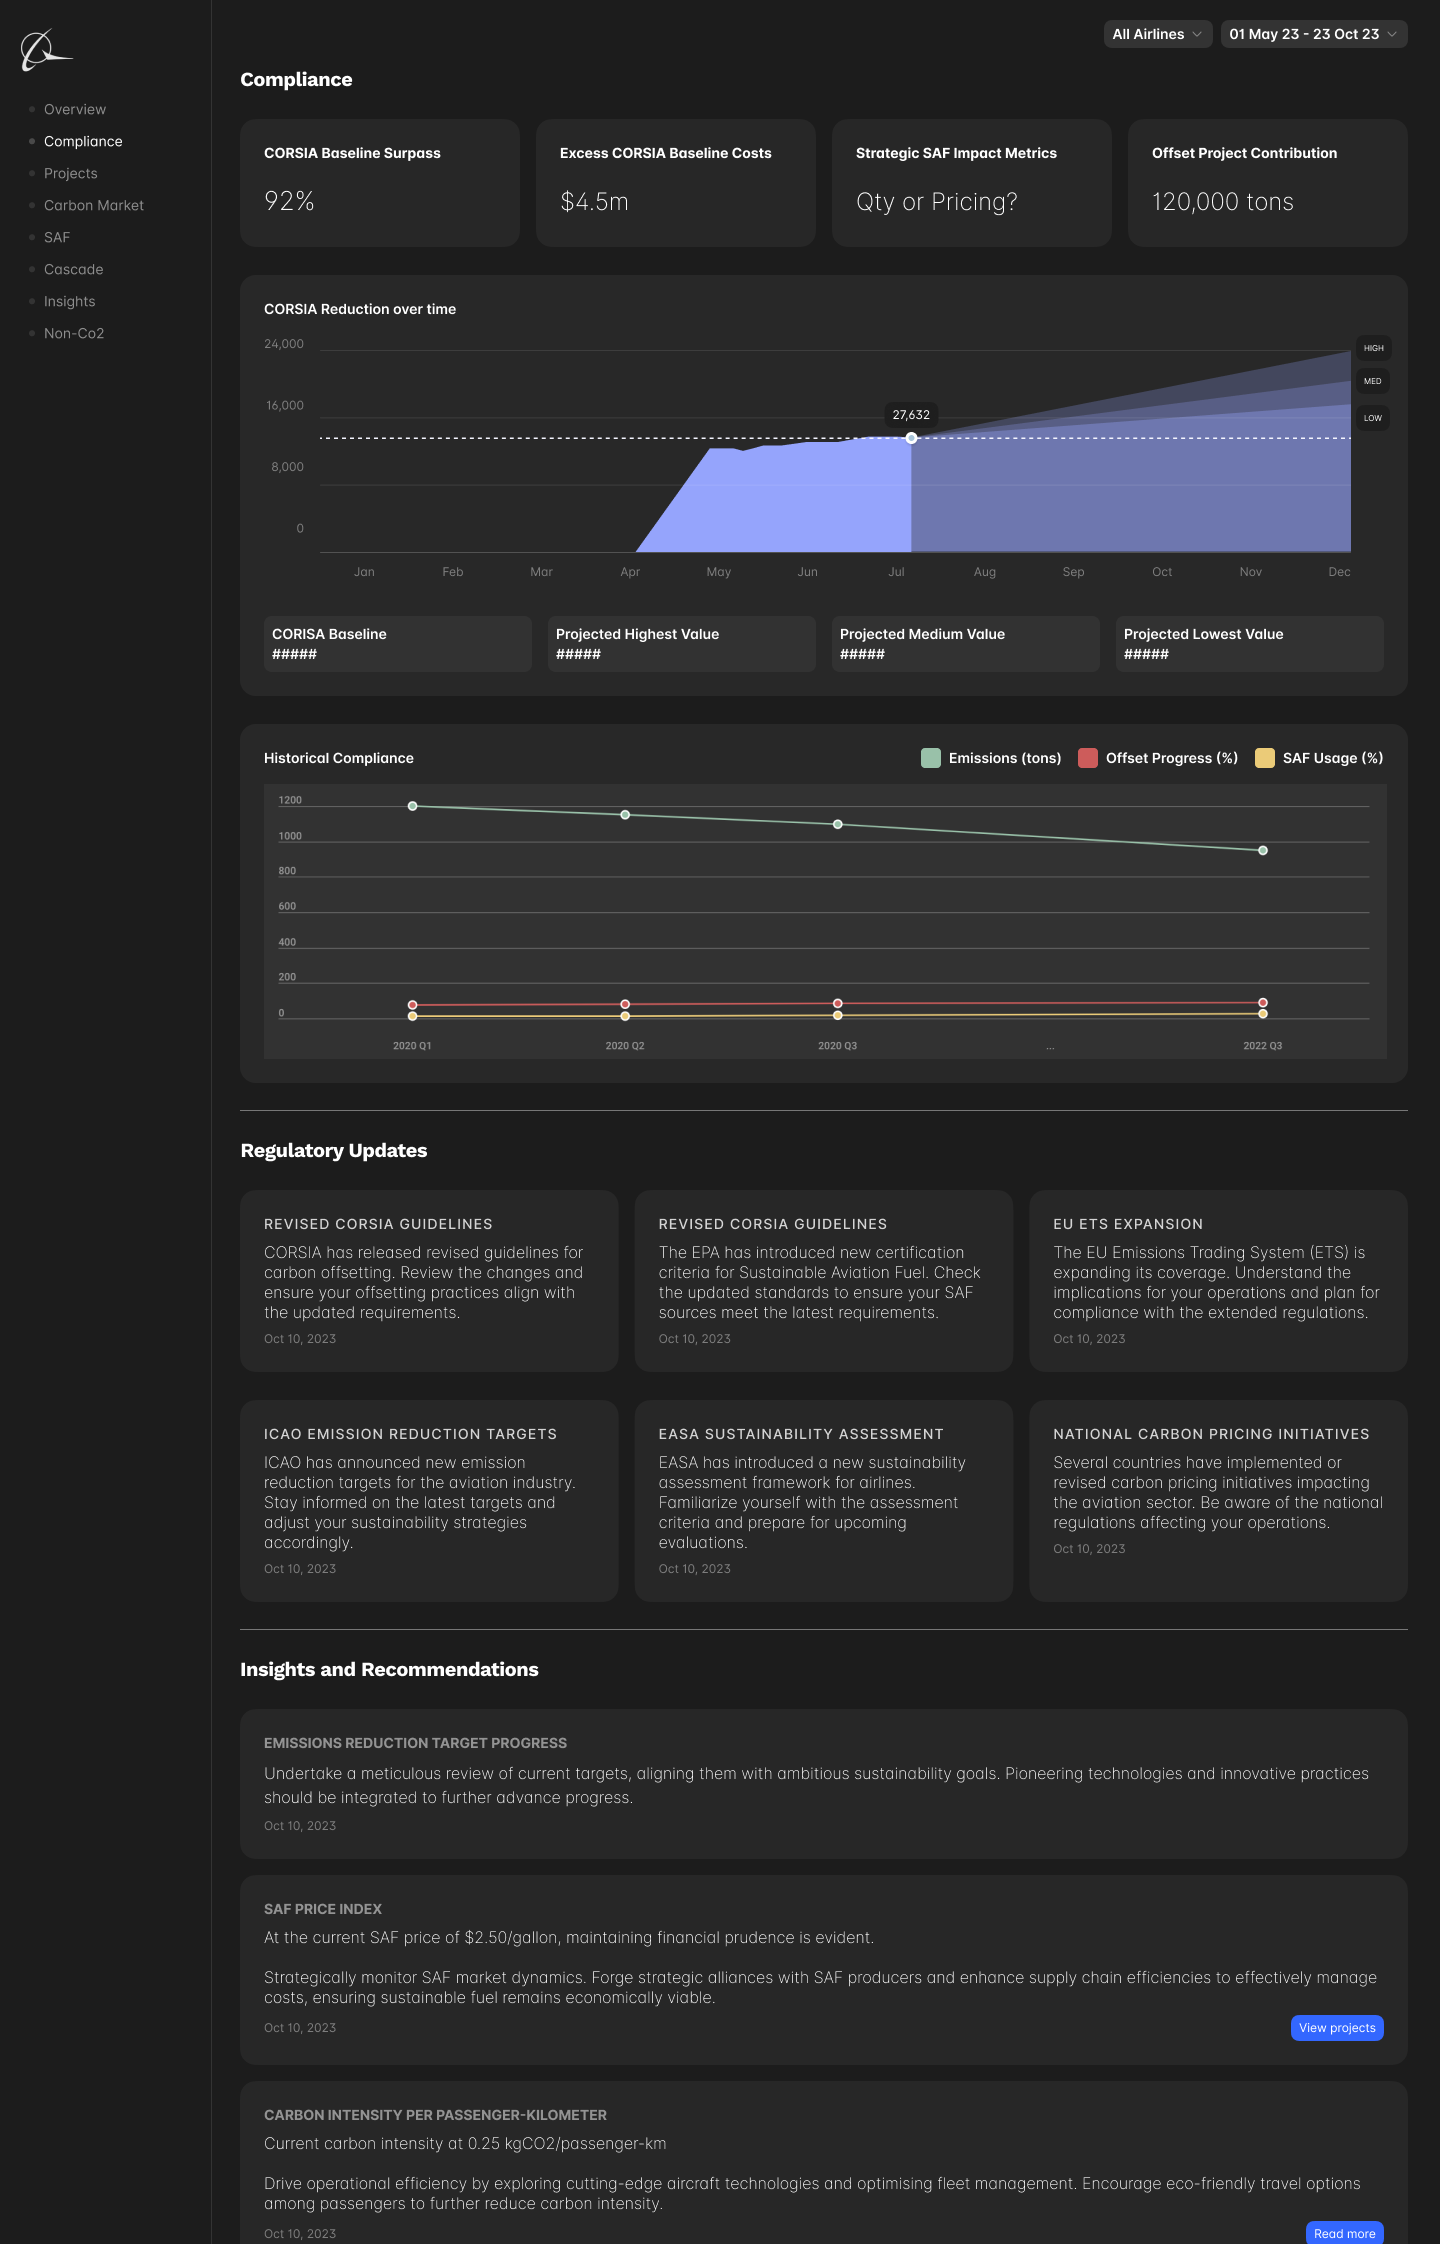
Automated Compliance Reporting:
- Auto-generated CO₂ reports aligned with aviation sustainability regulations (CORSIA, ICAO, etc.).
Impact & Results
50% Faster Decision-Making
Sustainability teams reduced emissions reporting time by half.
10-15% Reduction in Fuel Wastage
Pilots and engineers used predictive insights to optimise fuel efficiency
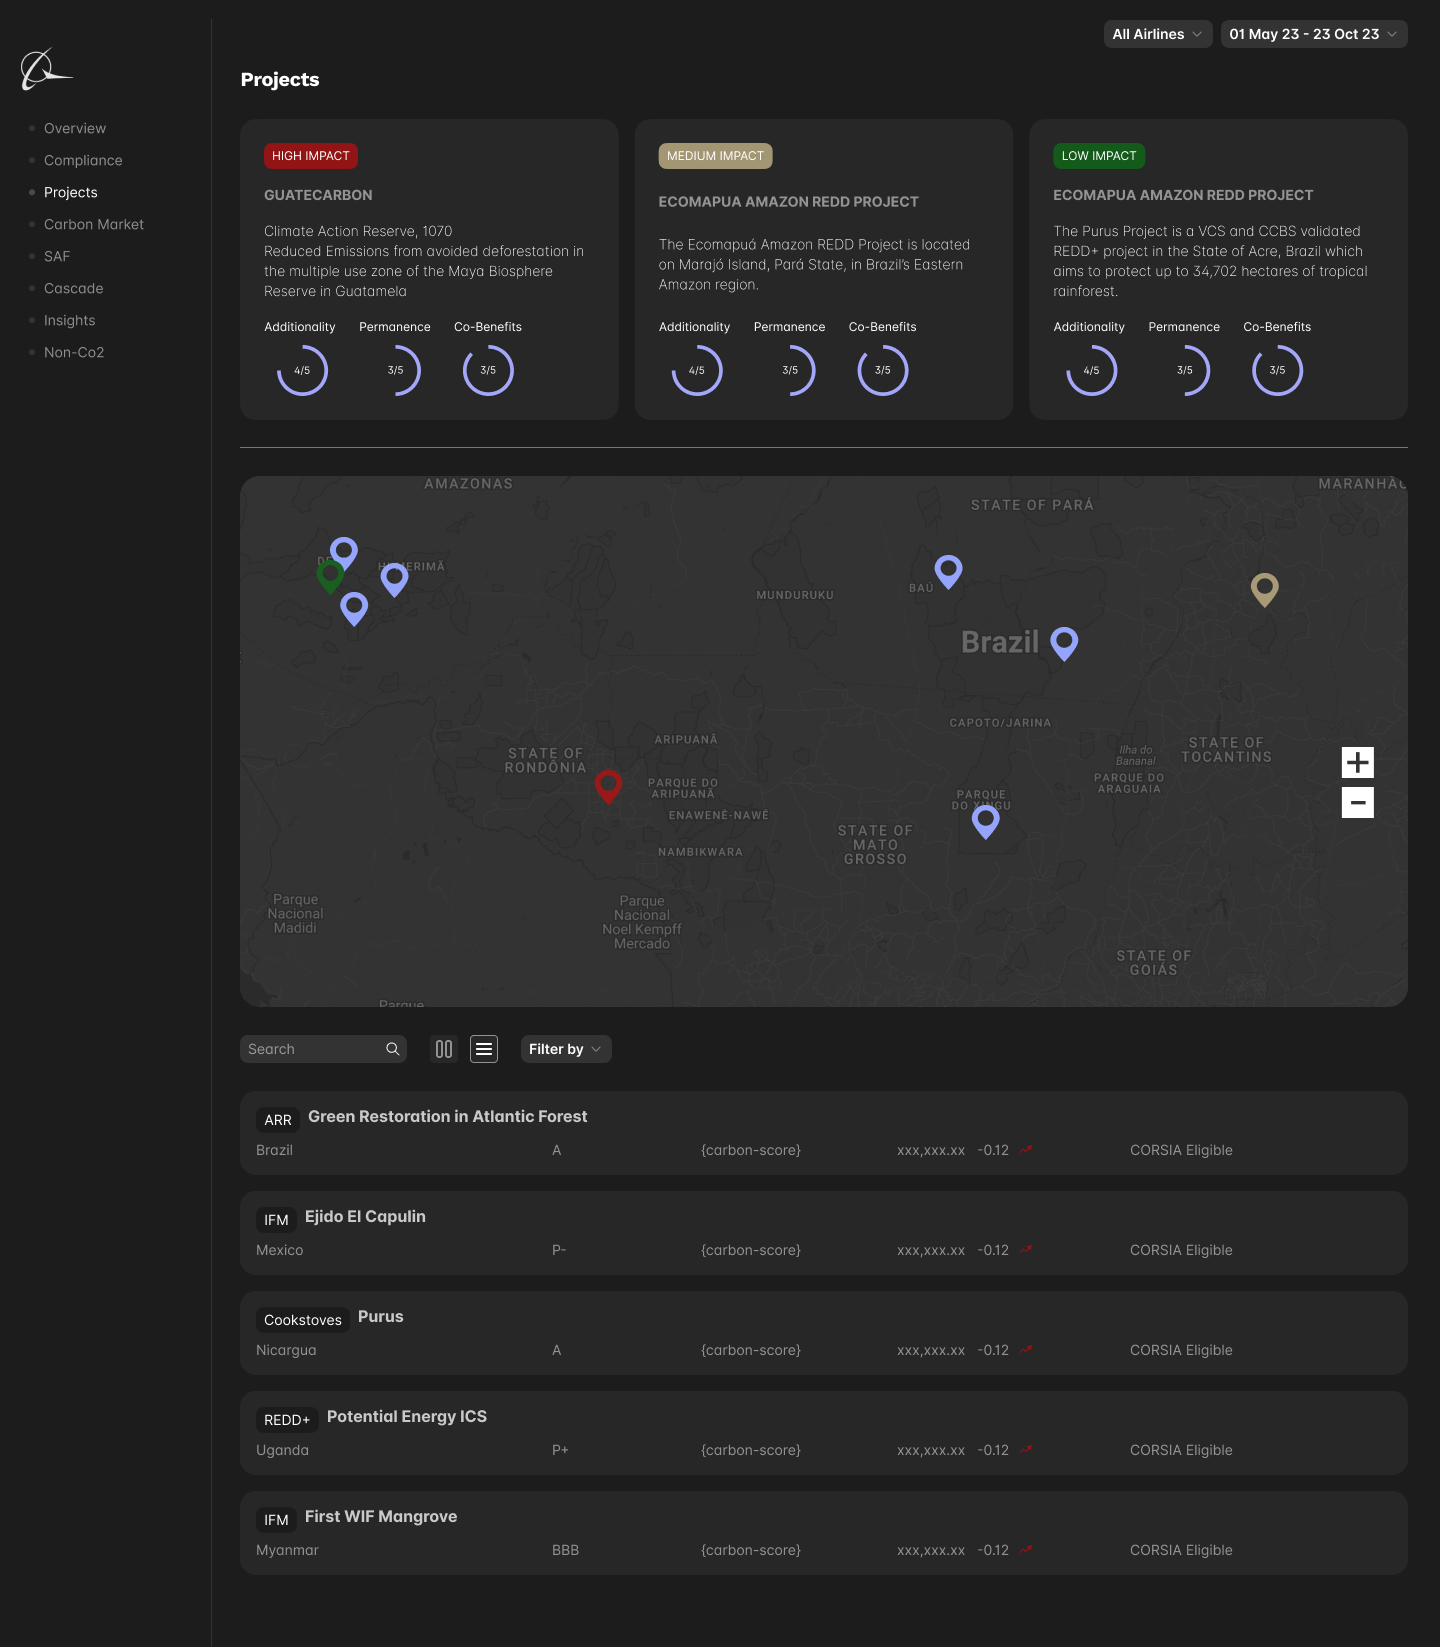
Stakeholder Adoption & Scalability
The new dashboard was adopted across multiple departments and integrated into Boeing’s long-term sustainability roadmap.
Transforming Data into Action: Boeing’s Carbon Emissions Dashboard Redesign
Boeing’s sustainability teams struggled with complex, hard-to-interpret emissions data, slowing down decision-making and impacting fuel efficiency.
Before: Overwhelming raw data, slow insights, limited actionability.
After: Interactive visualisations, predictive CO₂ savings, and streamlined reporting, empowering teams to cut emissions faster than ever before.